Blogs & Perspectives
Making Sense of Retail: Part I
How retailers can optimize the brick-and-mortar experience for end-users
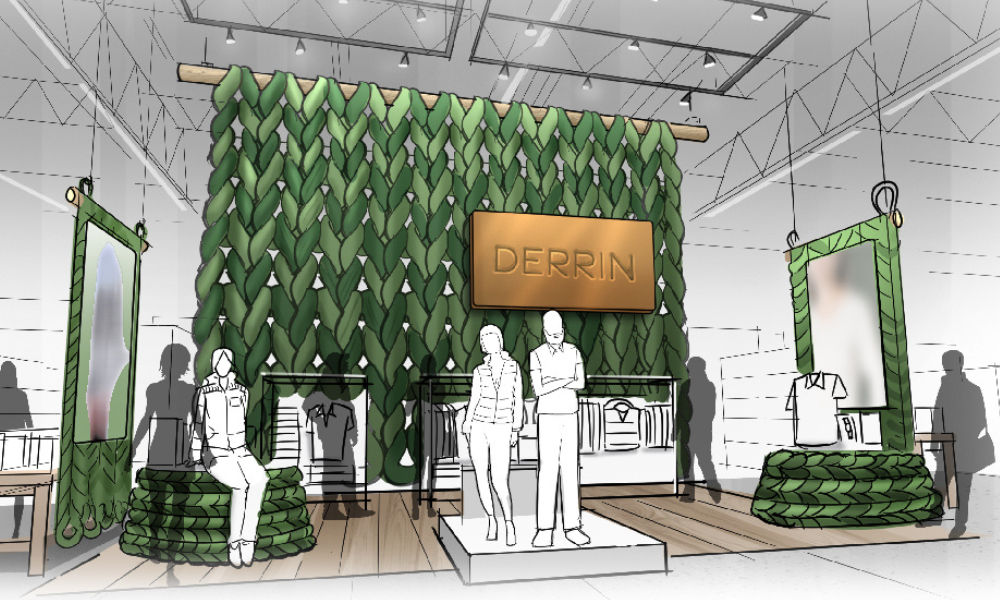
SUCCESSFUL RETAILERS RECOGNIZE the importance of delivering retail environments that enhance the experience for their customers. With so many options and channels available to shoppers today, a focus on optimizing the brick-and-mortar experience has become a greater priority for retailers and designers. Efforts to enhance that physical and personal shopping experience walk a fine line between trendy and traditional. Trendy store design that is not backed by in-store experience data can feel disconnected from shoppers’ desires and needs, while traditional retail design methodology is no longer sufficient to engage and energize shoppers. Today’s consumers may be inspired by in-store environments that appeal to their senses, which in most cases, haven’t been addressed by designers and retailers alike. Understanding how to incorporate the senses – sight, smell, sound, touch (and taste, when applicable) – into the design philosophy may provide retailers with a strategic, competitive advantage to create must-visit retail stores.
To learn more about the effects of in-store experiences on the senses and behaviors of specialty retail shoppers, BHDP (Cincinnati) initiated its fifth shopper study since 2020. This survey engaged 900 specialty apparel consumers nationwide in June 2022 and presented specific questions about four of the five human senses – sight, touch, sound, and smell – and the ways these senses either positively or negatively affect their in-store experiences.
Based on the responses collected from the survey, there is enough data to suggest that designing for a visual aesthetic alone may not be enough to create a positive and memorable in-store shopping experience. The results of the research shed new light on the significance of understanding human senses as they relate to the shopping process, and it offers retailers and retail designers insights into a possible new way of delivering the optimal in-store shopping experience.
Research Scope
General Set-Up
BHDP developed the research hypothesis, wrote the shopper questionnaire, and engaged an independent, online research firm to gather input from 900 apparel shoppers from across the United States.
Pre-Qualifications
To be eligible for the survey, respondents were required to have shopped in-store in the specialty brand category within a 30-day window prior to the survey launch. The 30-day window was to aid in shoppers’ recall of these visits. The retailers identified in the pre-qualifying survey question were American Eagle/Aerie/Offline, Athleta, Gap, H&M, J. Crew, Levi’s, Old Navy, Lululemon and Madewell. These brands were selected because they share a similar target audience, ensuring respondents were part of that demographic. However, the selected brands did not factor into the questions in the main survey. Respondents also were asked which store environment provided them with the most positive and negative experiences, and they had the option to elaborate on the experience in an open response field. While the initial questions identified certain specialty apparel brands to ensure respondents satisfied the eligibility criteria, the remainder of the survey questions were unrelated to a specific retail brand or store. Instead, the survey asked respondents about how their senses might influence their experience in a non-specified retail store environment.
The Survey
The survey presented each respondent four to five collages at random from a set of 26. Each collage contained pictorial representations of a human sense and respondents saw at least one collage from each of the four sense groups: sight, smell, sound and touch. The approach was to present respondents with imagery that was not necessarily an in-store setting but a representation of certain senses and determine if they reacted positively or negatively.
AdvertisementAfter viewing a collage, respondents were asked to “Imagine a shopping environment, like the examples pictured …” and respond to the question, “How does this environment make you feel?” by selecting from the following 14 response options: calm, satisfied, excited, relaxed, overwhelmed, stimulated, energized, anxious, fulfilled, unimpressed, bored, drained, frustrated and disappointed. Respondents could select one or more of the identified feelings for each collage and the order of these choices were randomized. Most respondents selected two to three choices for each collage. They were required to select from the 14 response options presented in the survey; “Other” or a space to write in an alternative to those 14 feelings was not an option. Each collage was shown randomly to an average of 138 shoppers.
Research Objectives
The goals of the research were to:
- To understand how sensorial experiences might affect shopper behaviors in-store.
- To introduce the positive and negatives of incorporating sensorial experiences into a store’s design aesthetic and environment.
- To define the opportunities to create optimal in-store experiences for shoppers.
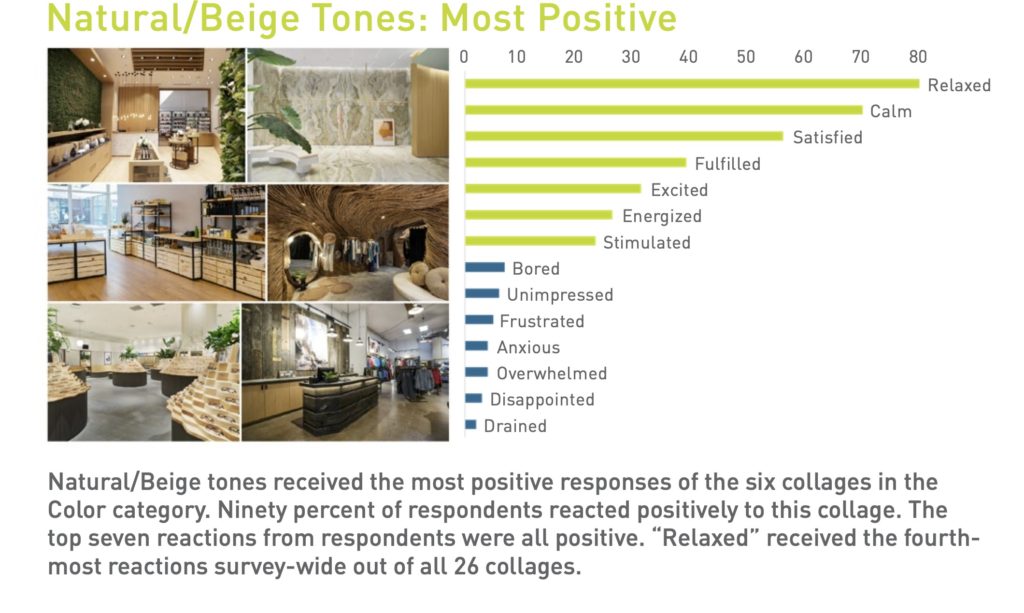
Natural/Beige tones received the most positive responses of the six collages in the Color category. Ninety percent of respondents reacted positively to this collage. The top seven reactions from respondents were all positive. “Relaxed” received the fourth-most reactions survey-wide out of all 26 collages.
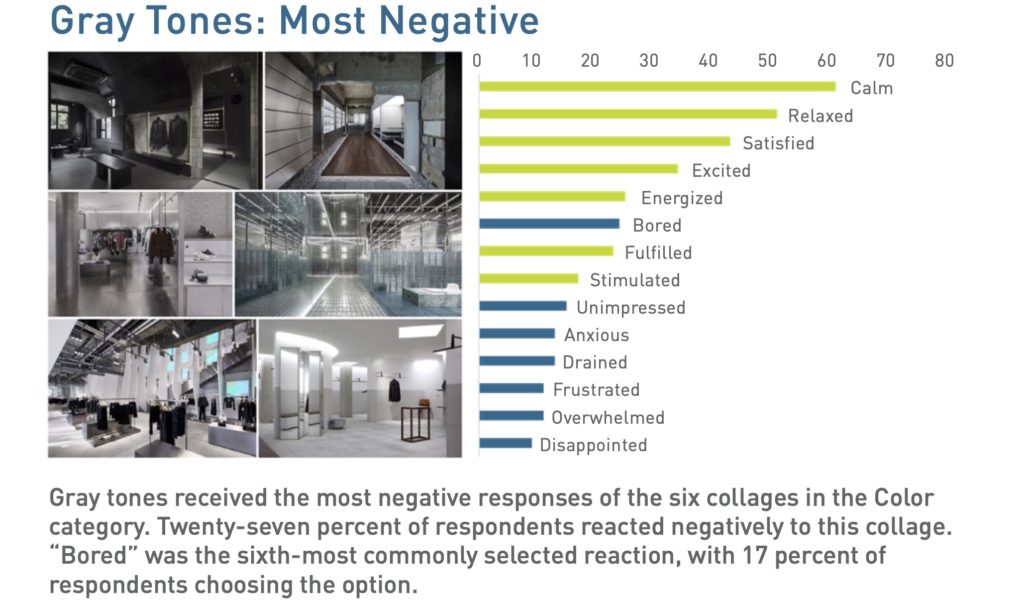
Gray tones received the most negative responses of the six collages in the Color category. Twenty-seven percent of respondents reacted negatively to this collage. “Bored” was the sixth-most commonly selected reaction, with 17 percent of respondents choosing the option.
Advertisement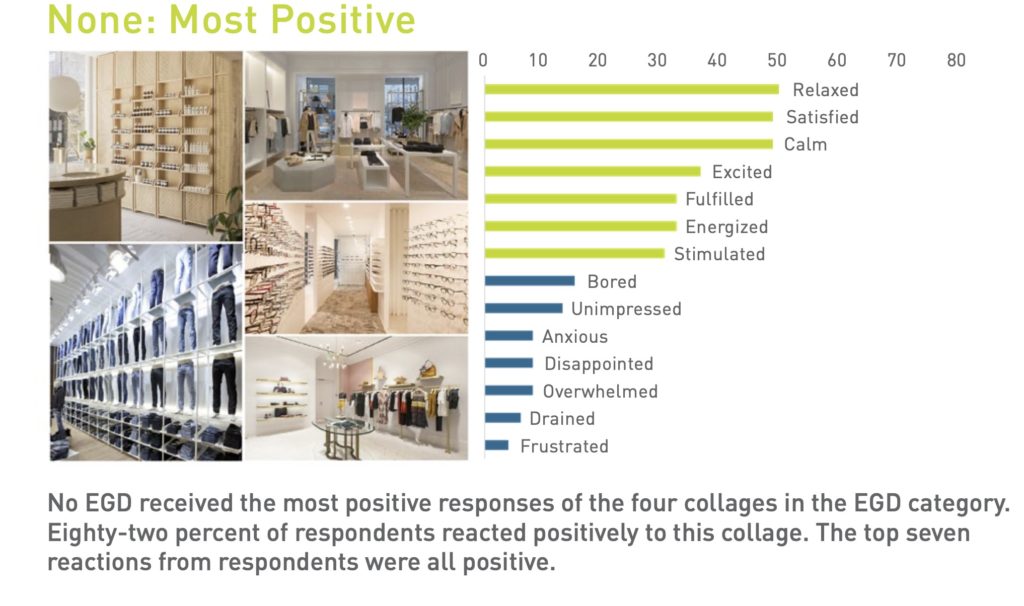
No EGD received the most positive responses of the four collages in the EGD category. Eighty-two percent of respondents reacted positively to this collage. The top seven reactions from respondents were all positive.
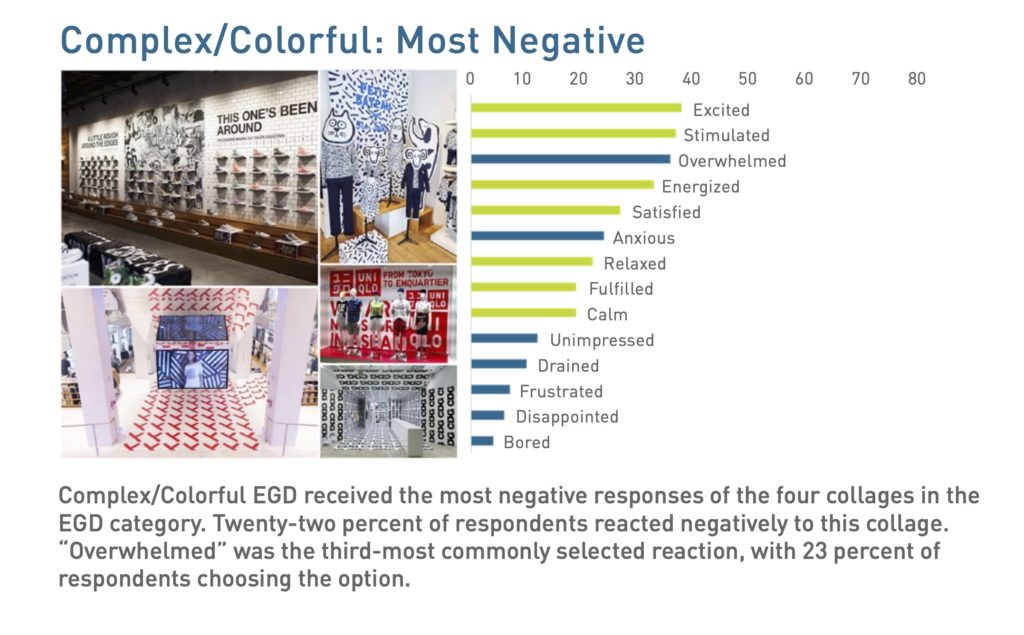
Complex/Colorful EGD received the most negative responses of the four collages in the EGD category. Twenty-two percent of respondents reacted negatively to this collage. “Overwhelmed” was the third-most commonly selected reaction, with 23 percent of respondents choosing the option.
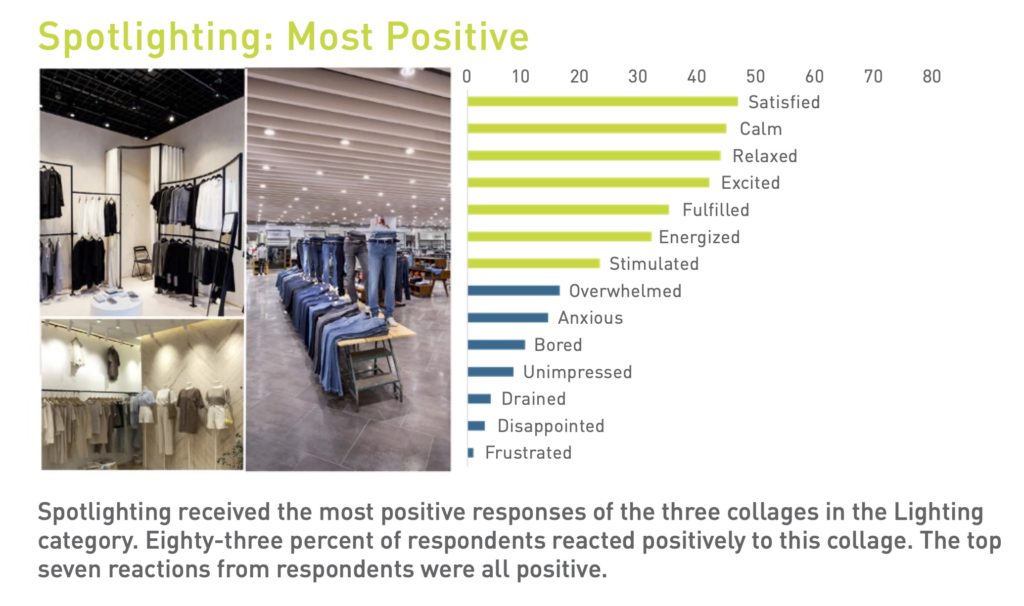
Spotlighting received the most positive responses of the three collages in the Lighting category. Eighty-three percent of respondents reacted positively to this collage. The top seven reactions from respondents were all positive.
Advertisement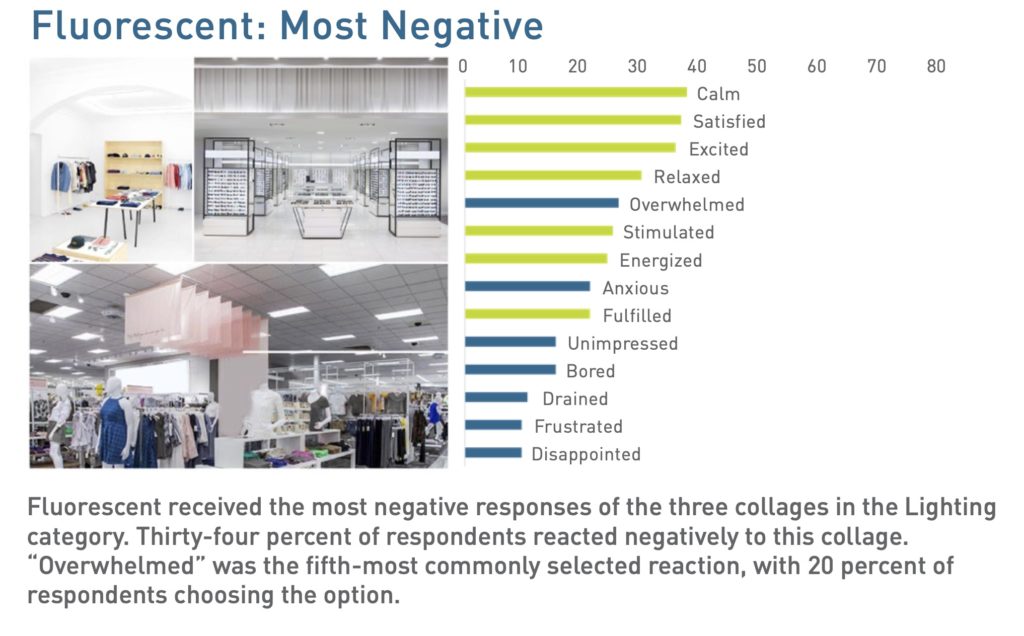
Fluorescent received the most negative responses of the three collages in the Lighting category. Thirty-four percent of respondents reacted negatively to this collage. “Overwhelmed” was the fifth-most commonly selected reaction, with 20 percent of respondents choosing the option.
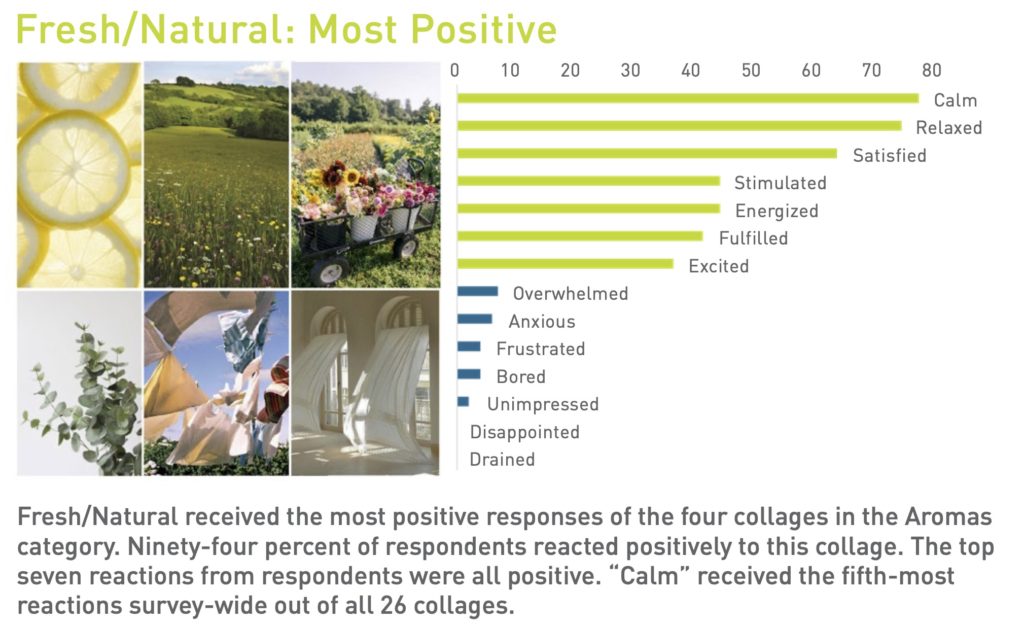
Fresh/Natural received the most positive responses of the four collages in the Aromas category. Ninety-four percent of respondents reacted positively to this collage. The top seven reactions from respondents were all positive. “Calm” received the fifth-most reactions survey-wide out of all 26 collages.
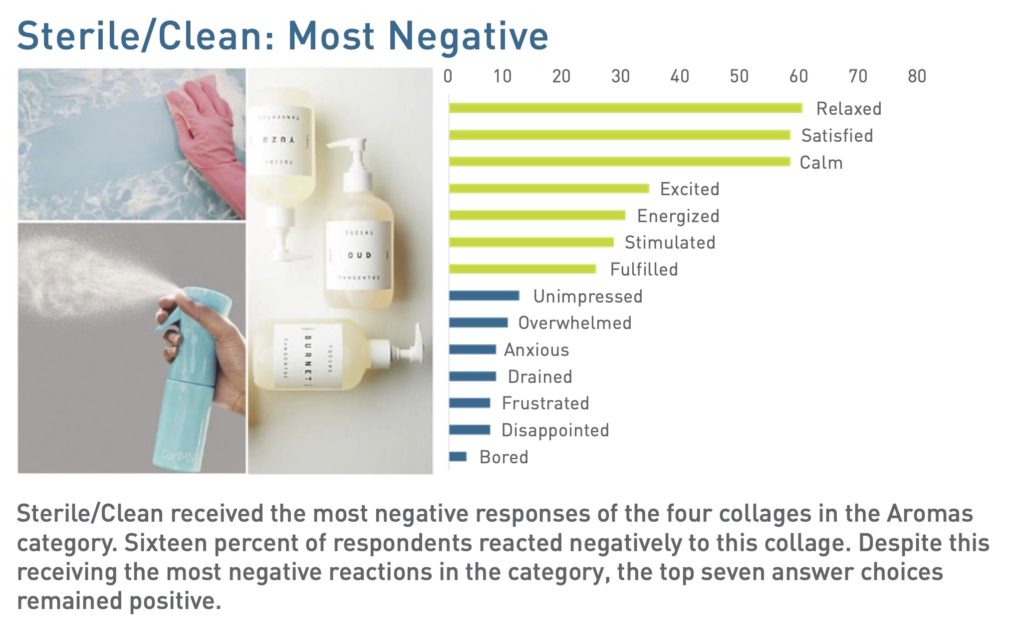
Sterile/Clean received the most negative responses of the four collages in the Aromas category. Sixteen percent of respondents reacted negatively to this collage. Despite this receiving the most negative reactions in the category, the top seven answer choices remained positive.
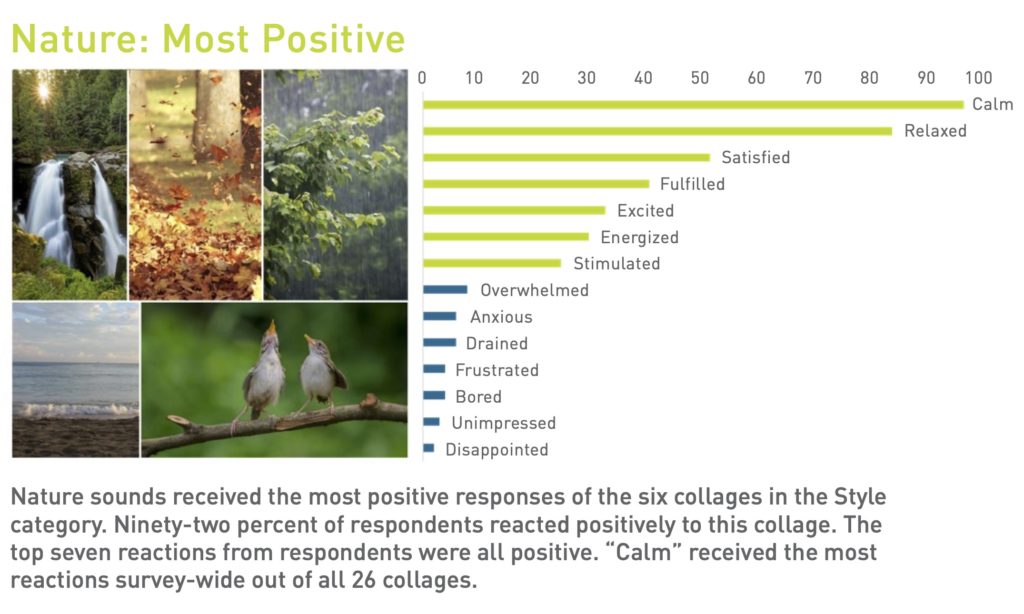
Nature sounds received the most positive responses of the six collages in the Style category. Ninety-two percent of respondents reacted positively to this collage. The top seven reactions from respondents were all positive. “Calm” received the most reactions survey-wide out of all 26 collages.
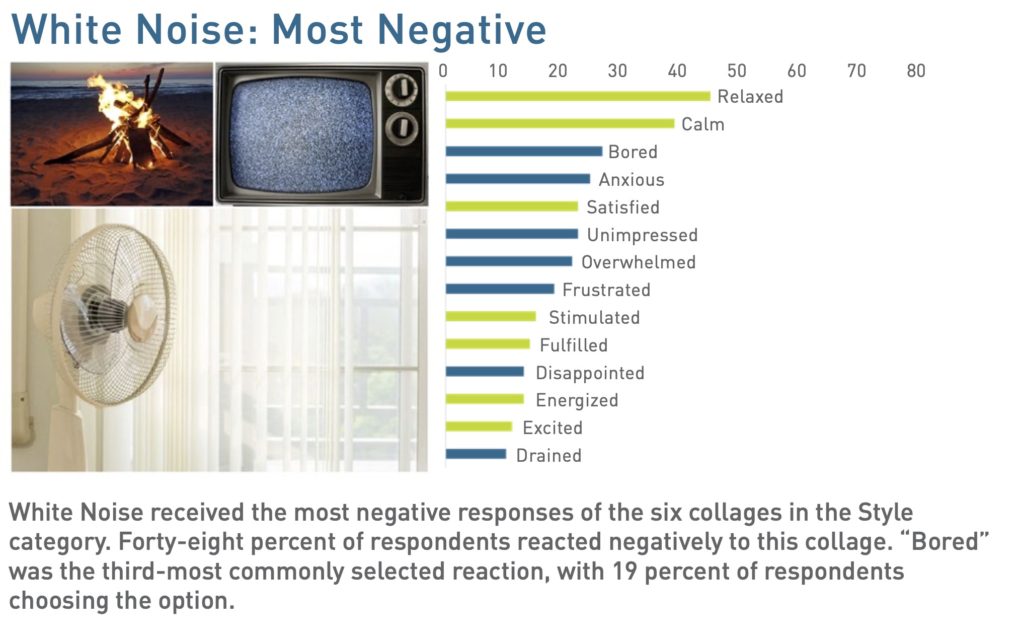
White Noise received the most negative responses of the six collages in the Style category. Forty-eight percent of respondents reacted negatively to this collage. “Bored” was the third-most commonly selected reaction, with 19 percent of respondents choosing the option.
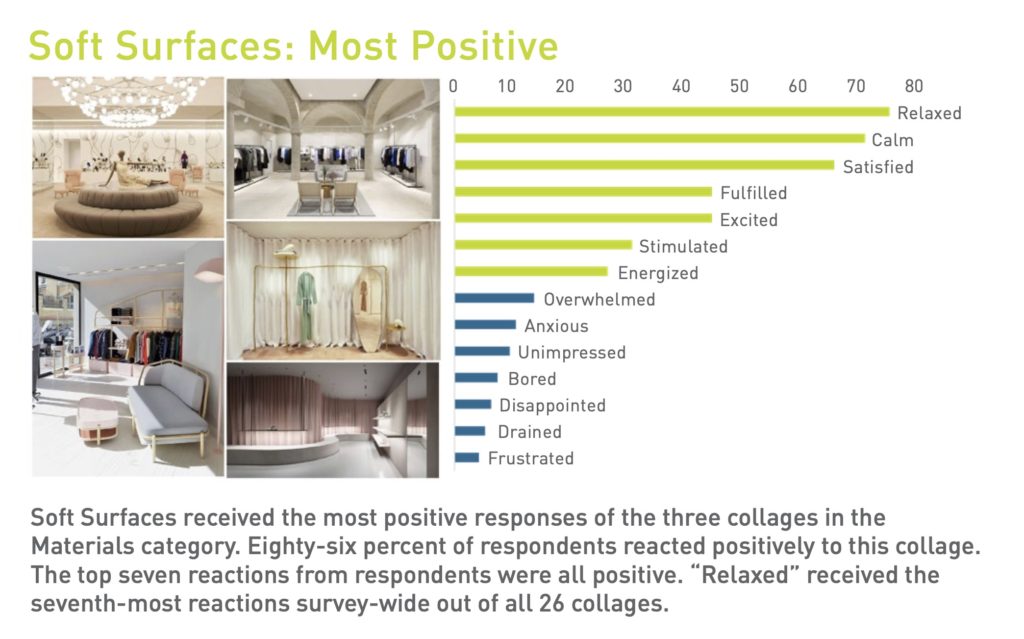
Soft Surfaces received the most positive responses of the three collages in the Materials category. Eighty-six percent of respondents reacted positively to this collage. The top seven reactions from respondents were all positive. “Relaxed” received the seventh-most reactions survey-wide out of all 26 collages.
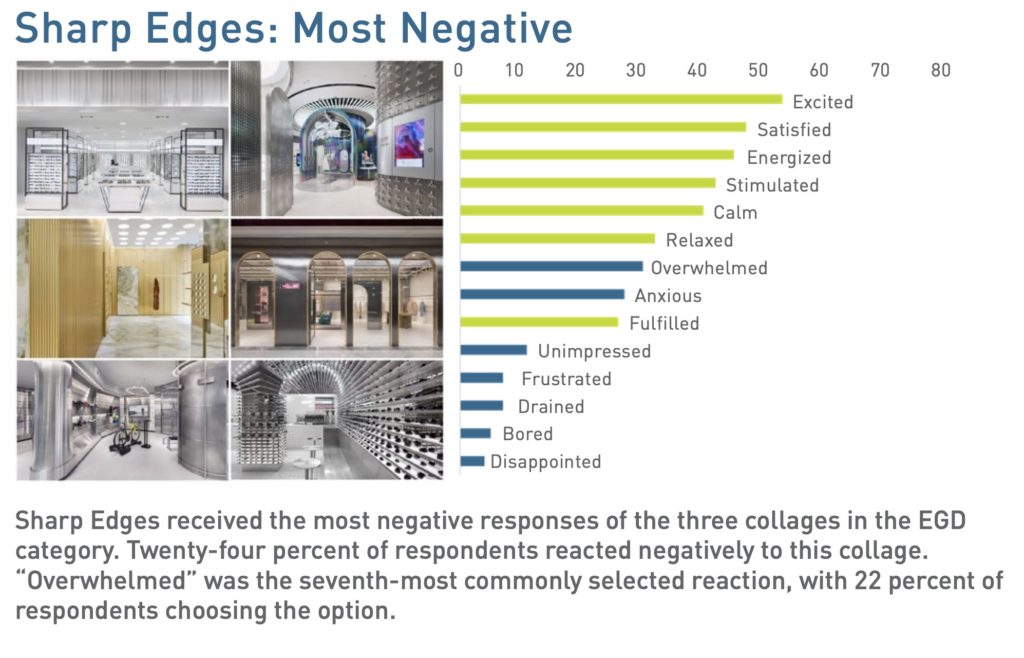
Sharp Edges received the most negative responses of the three collages in the EGD category. Twenty-four percent of respondents reacted negatively to this collage. “Overwhelmed” was the seventh-most commonly selected reaction, with 22 percent of respondents choosing the option.
Stay tuned to vmsd.com for Part II and III of this research study.
To view the full report on BHDP’s website, please click here.
7 design trends to drive customer behavior in 2024
In-store marketing and design trends to watch in 2024 (+how to execute them!). Learn More.


Crimes Against US Jewelers Fall Nearly 27% From Record High

Retail Markets in U.S., Canada Remain Tight

Obituary: Reginaldo Reyes


Bulletins
Get the most important news and business ideas from VMSD magazine's news bulletins.
-
 Photo Gallery1 week ago
The 2024 Shop! Design Awards Winners
-
 Headlines3 days ago
Target Sued for Biometric Surveillance
-
 Headlines1 week ago
ALDI Launches Checkout-Free Grocery
-

 Headlines1 week ago
Long Island Shopping Center Sold for $8M
-

 Designer Dozen2 weeks ago
2024 Designer Dozen: Evan Harkrider
-
 Headlines1 week ago
Micro Grocery Store Being Built in Tulsa
-

 Designer Dozen6 days ago
2024 Designer Dozen: Lisa Rachielles
-

 Headlines1 week ago
Anthropologie’s Terrain Unit Opens Store at Brooklyn Botanic Garden